California Geological Survey releases new tsunami hazard maps for Orange County

- Share via
The California Geological Survey announced Thursday a new, interactive tsunami hazard map is online for Orange County that officials say can be helpful in planning evacuations should one of the long, high sea waves threaten local communities.
The map is an update of the previous version, which was published in 2009. In Newport Beach, the tsunami hazard zone was increased slightly in the latest map to help facilitate evacuation responses. Hazard zones include the area between the Balboa Peninsula to Pacific Coast Highway and the Newport Back Bay.
Meanwhile in Bolsa Chica and Huntington Beach, the tsunami hazard zone decreased after new data showed that levees and ponds can help protect residents.
Tsunami hazard zones include Pacific Coast Highway, the ecological preserve, several channels and the Santa Ana River up to Adams Avenue.
Much of Laguna Beach’s tsunami hazard zone does not extend far inland, with the exception of Main Beach, where it extends as far back as Beach Street, and at Aliso Beach Park, where the hazard extends part-way into the Ranch at Laguna Beach.
A map for Los Angeles County was released in March. The state agency has so far updated maps in 13 coastal counties and plans to update the remaining seven within the next year.
Both maps were produced in collaboration with the California Governor’s Office of Emergency Services, AECOM Technical Services and the Tsunami Research Center at the University of Southern California. The maps include new data and improved computer modeling and a function that allows users to look up addresses to see if that location is in a designated tsunami hazard zone.
Hazard zones are highlighted in yellow while non-hazard zones are highlighted in green.
The agency added that it will also begin to include tsunami evacuation material to the online interface as it is developed.

“[California Geological Survey] is always learning new things about tsunami sources and new modeling techniques that help improve our tsunami hazard products,” said Jacob Roper, the assistant director of communications at the state Department of Conservation.
“The updated Tsunami Hazard Area maps include a baseline extreme tsunami source scenario equivalent to a magnitude 9.3 earthquake from the Aleutian Islands [near Alaska] representing a 1,000-year event,” said Roper. “The new maps also benefit from a better understanding of the ground surface showing where tsunami flow patterns are more likely to flood and not flood.”
Roper added that the maps also include a small and conservative buffer that puts the boundary of the tsunami hazard zones along the closest street or landmark to make it easier for users to tell whether or not they are in a hazardous area or outside of it.
Tsunamis aren’t common to California and historically, for the most part, have caused little to no damage.
But, that doesn’t mean that it’s outside of the realm of possibility.
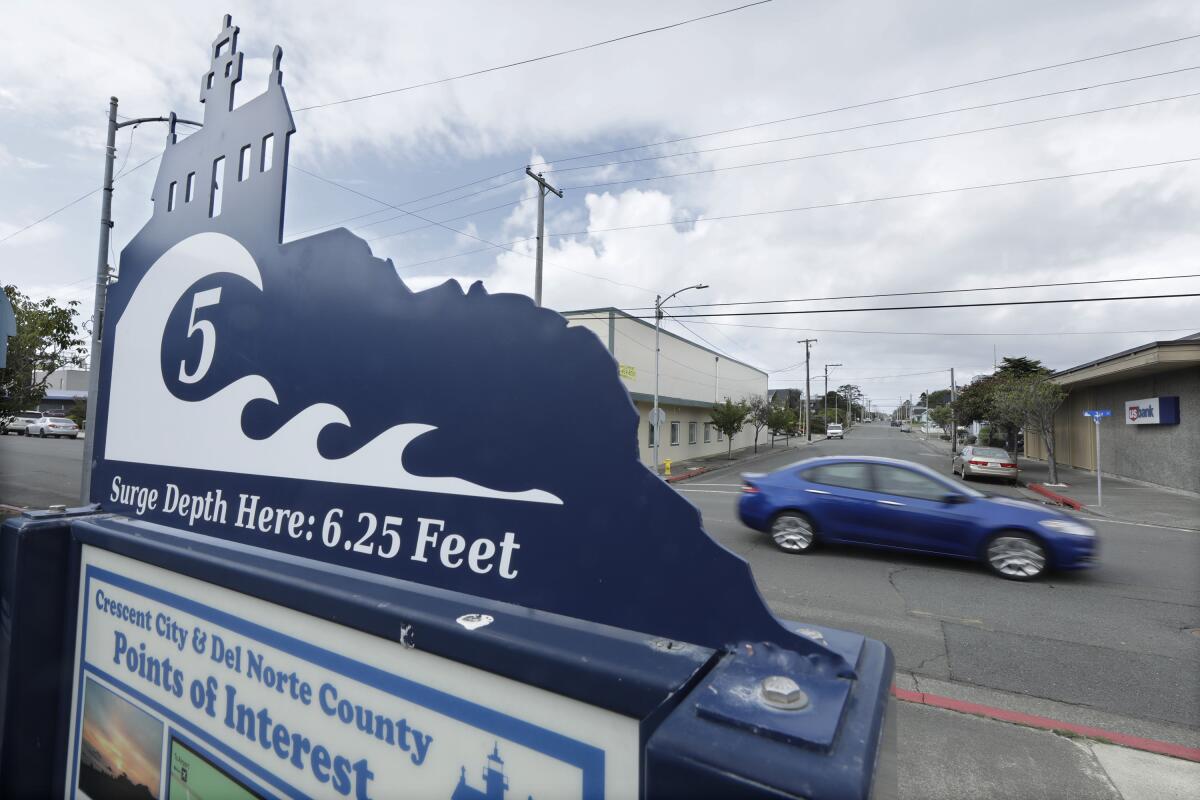
More than 150 tsunamis have hit California’s coast since 1800, but the most destructive of them was in 1964 when a tsunami — following a 9.2-magnitude earthquake in Alaska — hit Crescent City, killing 12 people and destroying 29 city blocks.
In Thursday’s announcement, officials noted that significant flooding as a result of a tsunami isn’t expected in southern Orange County, but that harbors and coastlines could be affected.
“While damaging tsunamis are infrequent in California, they have [happened] and do happen. If you live on or visit the coast, you need to be aware of this potential hazard,” said Steve Bohlen, the head of the California Geological Survey, in a statement.
Bohlen said the maps account for the possibility of a once-in-a-millennium tsunami event occurring because of the Tohoku-Oki earthquake and tsunami in 2011 that killed more than 15,500 people.
“Japan utilized data from several hundred years of tsunami records in its planning, which seemed perfectly reasonable,” said Bohlen. “Then it was impacted by a once-a-millennium tsunami. So, we’re taking a very conservative approach and using a thousand-year scenario as the baseline for our new maps, hoping to avoid the tragic loss of life experienced in Japan.”
To use the map visit conservation.ca.gov/cgs/tsunami/maps.
All the latest on Orange County from Orange County.
Get our free TimesOC newsletter.
You may occasionally receive promotional content from the Daily Pilot.


