How much COVID is in my community? It’s getting harder to tell

- Share via
With wide-reaching intervention against COVID-19 now firmly in the past, officials and experts continue to preach the importance of individual decision-making to assess and manage their health risks.
Monitoring coronavirus conditions is becoming more difficult, however, as the pandemic’s post-emergency phase has seen data collection and reporting endeavors either scaled back or abandoned entirely.
Part of this is by design. The collective experience with the coronavirus has shunted some incomplete metrics, such as officially reported case counts, in favor of others such as wastewater monitoring, which can provide a clearer picture of the virus’ circulation in a community.
But dwindling data make it more difficult to assess the virus’ trajectory in specific areas and for people to adjust their attitudes and behaviors accordingly — a potentially unsettling development for those who remain most at risk of falling seriously ill.
The end of the federal government’s health emergency has left COVID-conscious Americans feeling vulnerable. Here are some steps you can take to protect yourself.
And the public knowledge gap may widen in the months ahead, as metric collection becomes increasingly decentralized following the termination of the national COVID-19 public health emergency and more residents lose access to resources such as no-cost testing.
“Tracking is going to be quite a bit more difficult now. It’s already become more challenging over the last few months as states and localities have started to decrease the frequency of their reporting,” said Dr. Mario Ramirez, an emergency medicine physician and managing director at Opportunity Labs, a nonprofit research and consulting firm.
The Centers for Disease Control and Prevention has made several efforts at packaging pandemic conditions into digestible bites, including the unveiling of the agency’s COVID-19 Community Levels map in February 2022.
That system sorted counties nationwide into one of three categories — low, medium or high — based on case rates and certain hospitalization metrics. For each category, the CDC released tailored guidance on measures such as masking, testing and avoiding crowds.
With the nation’s COVID-19 public health emergency ending and less state cooperation, the CDC has a new plan for monitoring the coronavirus across the U.S.
However, officials on Thursday retired that system. While partly a reflection of the limitations of case counts, which have become increasingly unreliable because of the prevalence of at-home testing, officials also acknowledged the growing difficulty of providing an on-the-ground snapshot. Many states and counties have stopped gathering or reporting COVID-19 data.
On Thursday, the CDC’s COVID Data Tracker ended reporting of aggregate cases and removed test positivity data. The old tracker listed weekly COVID-19 deaths; the new version reports on the percentage of COVID-associated deaths among all reported deaths, based on provisional death certificate data, to indicate the COVID death trend.
The tracker’s lead data point was the number of people newly admitted to the hospital with a lab-confirmed coronavirus infection over the prior week.
The hospitalization data are offered down to the county level, with areas sorted into one of three tiers: green, yellow or orange. Much of the country is currently in the green tier, with fewer than 10 weekly coronavirus-positive hospital admissions for every 100,000 residents. The worst level, orange, is when the rate is 20 or more.
On Thursday, L.A. County reported a rate of 2.8 coronavirus-positive hospital admissions for every 100,000 residents.
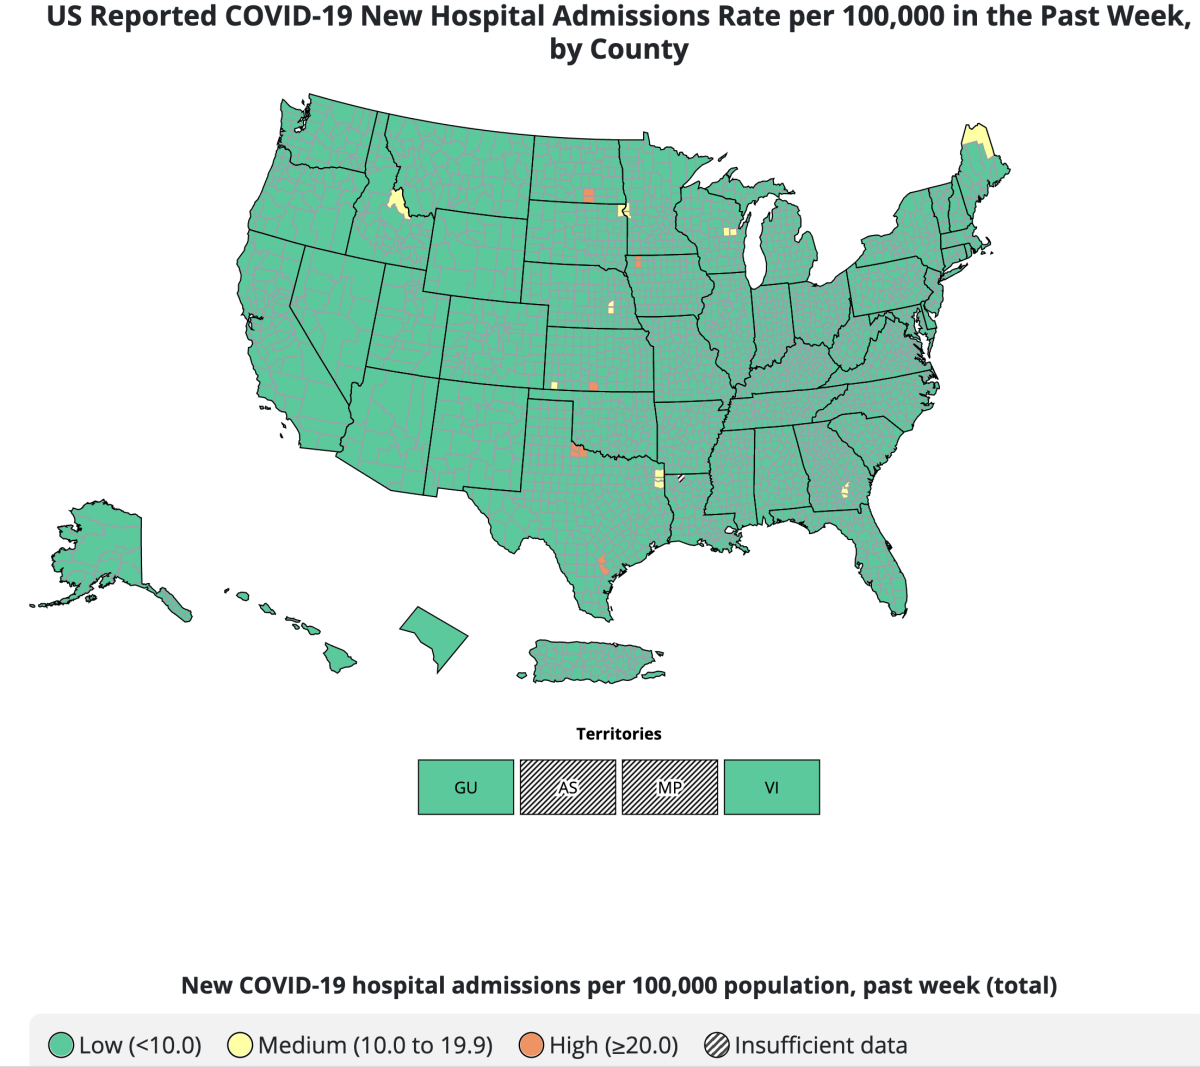
The weekly trend of coronavirus-positive hospitalizations is available for each state on the CDC’s site. For the week that ended May 6, California reported 1,284 coronavirus-positive hospital admissions, the lowest such rate since last spring’s lull.
The all-time low for this metric was 870 for the week ending April 16, 2022. The all-time peak — 16,663 — occurred over the week ending Jan. 9, 2021, in the midst of California’s deadliest COVID-19 wave. At that time, L.A.’s hospital morgues were so overwhelmed the National Guard was called in to help with the temporary storage of bodies.
While coronavirus-positive hospitalization metrics are vital in illustrating what, if any, pressure COVID-19 is exerting on hospitals, some experts note they provide only a limited look at transmission.
“Those are going to be much broader strokes than the sort of predictive forecasting analytics that we’ve gotten used to over the last few years,” Ramirez said Tuesday during a panel hosted by the COVID-19 Vaccine Education and Equity Project. “And so what I worry about is that by the time that data makes its way back, it’s usually two, three, four weeks old — particularly because hospitalization is a lagging indicator and certainly death is, as well. We will be several weeks behind an increase in cases if that’s what’s happening.”
The WHO said that even though the emergency phase of COVID-19 is over, the pandemic hasn’t come to an end, noting recent spikes in cases in some regions.
That’s not to say hospital-focused metrics don’t have their place. According to the California Department of Public Health, COVID-19 hospital admission levels “have shown 99% concordance” with community levels.
“We are reviewing how our data collection and reporting will change with the end of the federal emergency and will keep the public informed on any changes that may come,” the department wrote in a statement to The Times.
Currently, California publicly releases COVID-19 case and death data weekly on its online dashboard and also tracks the number of coronavirus-positive patients hospitalized statewide. That information is accessible at COVID19.ca.gov/state-dashboard.
Los Angeles County releases case and death data weekly every Thursday. Officials also provide the average percentage of emergency department encounters related to the coronavirus, a figure that remained stable around 3% for the past month. The number was 4% in late March and early April.
While expressing gratitude at the county’s progress, Public Health Director Barbara Ferrer noted “that each day thousands of people throughout Los Angeles County continue to be impacted by COVID-19, whether they need to miss work due to illness, require hospital care or are experiencing the effects of long COVID.”
“[The Department of] Public Health remains committed to work that reduces the chance of transmission and ensures the county remains prepared for the likelihood of periodic changes in transmission,” she said Thursday. “We’re continuing our work to make sure there are no barriers for anyone wishing to access life-saving vaccines, therapeutics and tests.”
The COVID-19 death rate in the U.S. fell by nearly 50% in 2022, a decline credited to widespread vaccinations as well as a rise in natural immunity.
The state also maintains a model — CalCAT, the California Communicable disease Assessment Tool — to approximate the extent of coronavirus transmission. That tool uses available data to generate an estimated effective reproductive rate, which demonstrates how many other people an infected individual is spreading the coronavirus to, on average.
However, this model is also not immune to changes in the availability of pandemic data.
“Overall, case metrics including R-effective are less reliable in the face of changes to testing patterns including the increased use of at-home/antigen testing compared to confirmed PCR testing,” state health officials wrote in response to a previous Times’ inquiry.
They added, though, that “as R-effective represents a rate of change, it can still be helpful to identify trends in COVID-19, especially when supplemented with hospitalization data.”
For example: The latest statewide R-effective estimate was 1.06, indicating that the spread of COVID-19 is probably stable. Correspondingly, the number of coronavirus-positive patients hospitalized statewide has fallen since the start of the month — from 1,282 on May 1 to 1,182 on Wednesday.
The U.S. Centers for Disease Control and Prevention recommended the allowance of an additional updated booster for seniors 65 and older as well as those who are immunocompromised.
Another key effort, both throughout the pandemic and moving forward, is wastewater surveillance. Officials say that gives a more comprehensive picture of how prevalent the virus is in a given area than testing alone and can assist in identifying and tracking any possibly worrisome mutations.
In California, the Department of Public Health anticipates “that wastewater monitoring will become a regular part of public health surveillance for COVID-19” and “has a potential role in the monitoring of other pathogens of public health importance as well, such as for mpox and influenza.”
“At the local health department level, wastewater surveillance also has the potential to add useful localized information for health systems, facilities or campuses needing to monitor COVID-19 or other diseases of public health importance,” the department wrote in its statement last week.
Findings of the state’s wastewater surveillance network, Cal-SuWers, are updated regularly online.
Arcturus has been making up a greater percentage of coronavirus cases nationwide.
The L.A. County Department of Public Health also regularly reports wastewater data in its weekly news releases. On Thursday, the county reported its levels were just 11% of last winter’s peak, according to the most recent data available.
And last week, San Francisco International Airport announced it’s the first airport in the nation to start a CDC program monitoring wastewater samples from internationally arriving flights.
Whatever the current extent of the coronavirus, however, officials say there are several things residents can do to protect themselves.
“While the COVID emergency declarations are ending, the virus is still with us,” the state public health department wrote in its statement. “It’s important for Californians to continue to use the tools we have in place to fight COVID, including vaccines, testing and treatment.”
More to Read
Sign up for Essential California
The most important California stories and recommendations in your inbox every morning.
You may occasionally receive promotional content from the Los Angeles Times.
