The number of Californians represented by unions grows as national labor organizing stagnates

- Share via
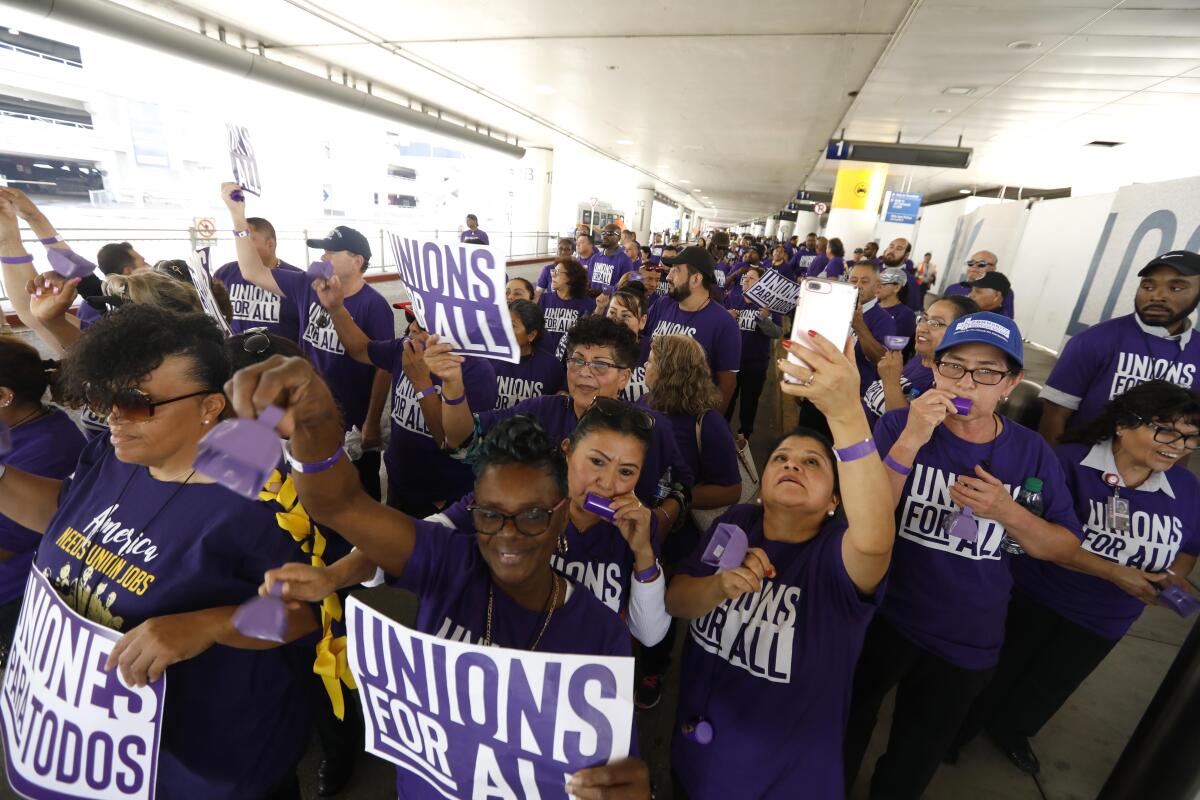
The number of Californians represented by unions rose by 139,000 last year in the wake of successful organizing campaigns across occupations as varied as nurses, electricians, animation artists, scooter mechanics and university researchers.
The Golden State’s 2.72 million represented workers amounted to 16.5% of its labor force, up from 15.8% in 2018, according to data released Wednesday by the U.S. Bureau of Labor Statistics.
The uptick comes after years of declines in both numbers and share of the workforce, which mirrored national trends. Two decades earlier, 18.3% of California workers were unionized.
“We’re seeing a reinvigoration in organizing across California, including in healthcare, online media, technology and entertainment,” said Steve Smith, a spokesman for the California Labor Federation, an umbrella group for 1,200 unions.
The growth has been enabled by a labor-friendly Legislature enacting measures to crack down on wage theft and retaliation against union organizers. New laws require retail and construction companies to take “joint employer” responsibility for labor violations by subcontractors. State regulators have leveled millions of dollars in fines for misclassification of workers as independent contractors, opening the way for employees to unionize.
For California businesses, 2020 will be a year of reckoning. Sweeping new laws curbing long-time employment practices take effect, aimed at reducing economic inequality and giving workers more power in their jobs.
Even as California labor notched gains, the number of U.S. workers represented by unions stagnated. Nationwide, 16.4 million workers were represented by a union last year, up by just 3,000 from 2018.
The share of U.S. workers represented by a union declined slightly, to 11.6%, from 11.7% in 2018. The drop can be partly attributed to the fact that, as the job market expanded, the number of workers entering the labor force grew faster than the number represented by unions: 1.2% vs 0.02%.
Historically, however, unions have suffered a steep decline: in 1979, 27% of U.S. workers were unionized.
The waning can be partly attributed to slower growth in industries with traditionally strong unions. Manufacturing companies from aerospace to automobiles have expanded in less labor-friendly Southern states and have outsourced blue-collar jobs to foreign countries.
In a paper analyzing the BLS numbers, Heidi Shierholz, senior economist for the Washington-based Economic Policy Institute, a labor think tank, suggested that “the erosion of union coverage is not because workers don’t want unions anymore — survey data show a higher share of nonunion workers today say they would vote for a union than was the case 40 years ago,” she wrote.
Rather, she contended, the drop is the result of “fierce corporate opposition” and weak federal penalties for intimidating and firing pro-union employees. “It is now standard for employers to hire union avoidance consultants to coordinate intense anti-union campaigns,” she added, citing an EPI study estimating corporate spending of $340 million per year on union avoidance.
The Trump administration loosened the federal government’s “joint employer” rule for businesses that contract out work, making it harder for victims of wage theft at staffing agencies and subcontractors to sue companies where the violations take place.
The corporate pushback is reflected in the fact that union membership is five times higher among public employees than private-sector workers. In 2019, the share of public-sector workers represented by a union held steady at 37.2%. The share of private-sector workers represented by a union ticked down to 7.1%, from 7.2%.
A June 2018 U.S. Supreme Court decision, Janus v. AFSCME, had been widely predicted as likely to weaken public-sector union membership. The decision barred state and local unions from charging workers “fair share fees” when they decline to join, but nonetheless enjoy raises and benefits as a result of collective bargaining.
However, the new BLS data show no clear “Janus” effect. Union membership did drop among local government workers last year, from 40.3% to 39.4%. But it was offset by the share of unionized state government workers, which rose from 28.6% to 29.4%.
Within the public sector, union membership was highest among police officers, firefighters, and teachers. Private-sector industries with high unionization rates included utilities, transportation and warehousing, and telecommunications.
Among full-time wage and salary workers, union members had median weekly earnings of $1,095 in 2019, while nonunion members had median weekly earnings of $892.
However, the BLS noted, “In addition to coverage by a collective bargaining agreement, these earnings differences reflect a variety of influences, including variations in the distributions of union members and nonunion employees by occupation, industry, age, firm size or geographic region.”
More than half of union members in the U.S. lived in just seven states — California, New York, Illinois, Pennsylvania, New Jersey, Ohio and Washington — the BLS said, although these states accounted for only about one-third of U.S. employment.
The states with the highest percentage of represented workers last year were Hawaii (25.5%), New York (22.7%), Washington (20.2%), Rhode Island (19.0%) and Alaska (18.7%). The states with the smallest shares were South Carolina (2.7%), North Carolina (3.4%), Georgia (5.0%), Virginia (5.2%) and Texas (5.2%).
Union membership in 2019 was similar among men and women: 10.8% vs 9.7%. The gap has narrowed considerably since 1983 — the earliest year of comparable data — when 24.7% of men and 14.6% of women were unionized.
Among major race and ethnic groups, black workers continued to have a higher union membership rate in 2019 (11.2%) than white workers (10.3%), Asians (8.8%s) or Latinos (8.9%).
The BLS data cover both union membership (6.2%) and workers who are represented by unions (7.1%) but not always members. It is collected as part of the Current Population Survey (CPS), a monthly sample survey of about 60,000 eligible households that obtains information on employment.
More to Read
Inside the business of entertainment
The Wide Shot brings you news, analysis and insights on everything from streaming wars to production — and what it all means for the future.
You may occasionally receive promotional content from the Los Angeles Times.


