Uh-Oh, âJanuary Barometerâ Points to Clouds Ahead
Weâre only one month into 2000, but is it already time to give up on the new year?
One well-known stock market indicator says it is.
The so-called January Barometer is flashing a warning sign about stocksâ performance for 2000: Historically, the trend of major market indexes in January foreshadows how theyâll fare in the full year.
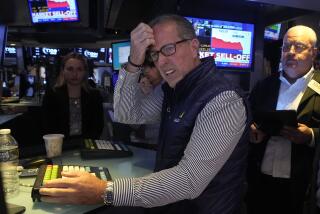
Despite a surge in blue chips and a modest recovery in technology stocks on Monday, the market is in solidly negative territory so far this year.
The Dow Jones industrial average, which jumped 201.66 points to 10,940.53 on Monday, still lost 4.8% in January overall.
The Standard & Poorâs 500 rose 2.5% Monday but was off 5.1% in January. The Nasdaq composite index lost 3.2% for the month after a 1.4% rally on Monday.
The January Barometer has gained a wide following among investors because it has been accurate about 80% of the time since 1950.
Since 1900 the Dow has slipped more than 2% in 20 Januarys, and on average finished those years down 11%, according to Markethistory.com.
Only once since 1950 has an S&P; loss of more than 4% in January failed to signal either a losing year or a flat year for the index.
Why investorsâ mood toward stocks in the first month of the year should set the tone for the year is anyoneâs guess. Analysts for a long time suggested that, with a clean slate as the calendar turned, savvy investors would carefully weigh the marketâs prospects each January and make their bets.
But just because the January Barometer has had a highly accurate predictive record historically doesnât mean it should be viewed as gospel.
For one thing, as veteran market technician John Bollinger points out, the January Barometer has a built-in head start on whatever it appears to be predicting, since Januaryâs return is a component of the full-year return.
In some cases, a negative return for a full year might be a positive return if you count from Feb. 1. In 1960, for example, the S&P; index slid 7.1% in January but was off just 3% for the year--a net gain for someone who bought just after the January decline.
Perhaps most important to investors today, the bull market of the 1990s has routinely broken many long-standing ârulesâ about how it should act.
In any case, the January Barometer has a better track record predicting large gains than large losses for the year.
The January Barometer also has been more accurate in odd-numbered years than in even-numbered ones. In 1994, for example, the indicator gave a bum signal, with the S&P; up in January but down for the year.
Some market historians think the January Barometerâs negative reading this year will be outweighed by the positive signal coming from another ballyhooed market gauge: Historically, stocks have done very well in presidential election years, particularly in the second half of those years.
In fact, of the four years in every election cycle, the cumulative gain in the election years is second only to the gain in the one-year periods immediately preceding elections, according to Stock Traderâs Almanac.
In election years, stocks are up better than two-thirds of the time.
However, the almanac also warns that in âincumbent-lessâ years--those in which a president was finishing his second term and therefore ineligible for reelection--the market fell six of seven times.
Confused enough?
Yale Hirsch, Stock Traderâs Almanac editor and publisher and one of the best-known trackers of the January Barometer, thinks his pet indicator will not hold up this year.
Heâs betting that interest rates wonât rise that much more and that the economy will continue to expand.
âOverall, we will end the year on the upside,â Hirsch predicts.
William Noble, strategist at Markethistory.com, also doesnât think investors should get too worried by Januaryâs performance, especially considering the marketâs 1999 fourth-quarter surge.
âIt would seem almost mindless to get bearish on the market at these levels just because the market closed down in January,â Noble said.
Noble thinks stocks could be shaky between now and April but that they will begin to move higher in May.
Going back to 1952, losses have occurred in five of the 12 election years between January and April, according to Stock Traderâs Almanac. But the market has been strong between May and December.
Another widely watched indicator, the so-called January Effect, showed mixed results for investors this year. The January Effect posits that small-cap stocks should outperform larger issues during the month.
They did so in January: The S&P; small-cap index fell 3.1% for the month, less than the S&P; 500âs 5.1% drop.
The logic is that many investors dump small caps at the end of the previous year for tax-loss purposes and then buy them back in January.
But in recent years, the January Effect has been a no-show. Some market watchers have suspected that there has been a December Effect instead, as investors, anticipating a jump in January, establish their positions early.
Whether this yearâs better performance of small-cap stocks in January says anything about their prospects for the year, however, is anyoneâs guess.
Meanwhile, one other well-known market barometer is flashing a bullish signal.
The victory of the Los Angeles Rams in the Super Bowl on Sunday is a soothing sign--if you believe the Super Bowl Indicator.
How someone began to notice this isnât clear, but historically the stock market has risen in the years when the National Football Conference team has won. When the American Football Conference team has won, the market has suffered some huge declines--including in 1973 and 1974, when the AFC Miami Dolphins won.
Itâs not quite as simple as that, however: The indicator counts as NFC teams the three AFC teams that were part of the old National Football League before it merged with the American Football League in 1970. (Those three teams: the Pittsburgh Steelers, Indianapolis Colts and Cleveland Browns--now the Baltimore Ravens.)
Given that the market mostly has risen since 1974, counting the once-invincible Steelers as an NFC team obviously has helped the indicatorâs accuracy.
Overall, the indicator had a 90% accuracy rate--going into 1998, that is. But then it stopped working. The AFC Denver Broncos won the Super Bowl in 1998 and 1999, yet the market--at least as measured by blue-chip stocks--had spectacular years in â98 and â99.
Another market âruleâ blown away by the â90s bull market.
(BEGIN TEXT OF INFOBOX / INFOGRAPHIC)
Another Worry for the Bulls
Wall Streetâs âJanuary barometerâ holds that the stock market is highly likely to have an up year if stocks rally in January--but a down year, or only a marginal gain, if stocks fall in January. How key indexes fared last month, and what history shows:
Most Major Indexes Fell in January . . .
Weighed down by worries that the Federal Reserve will push interest rates sharply higher--and by heavy profit-taking after the fourth quarterâs stunning market gains--most key stock indexes fell between 3% and 5% in January. Price changes, Dec. 31 to Monday:
(BEGIN TEXT OF INFOBOX / INFOGRAPHIC)
The Market and the Election Cycle
The stock market, as measured by the blue-chip Standard & Poorâs 500 index, has since 1949 recorded its biggest gains, on average, in the third year of U.S. presidentsâ terms. The weakest returns have typically been in the first year of presidentsâ terms--although that hasnât been true since 1985. Returns listed here are total returns (price changes plus dividends).
*--*
Term Yr. 1 Term Yr. 2 Term Yr. 3 Term Yr. 4 Year S&P; Year S&P; Year S&P; Year â49 +18.8% â50 +31.7% â51 +24.0% â52 +18.4% â53 --1.0 â54 +52.6 â55 +31.6 â56 +6.6 â57 --10.8 â58 +43.4 â59 +12.0 â60 +0.5 â61 +26.9 â62 --8.7 â63 +22.8 â64 +16.5 â65 +12.5 â66 --10.1 â67 +24.0 â68 +11.1 â69 --8.5 â70 +4.0 â71 +14.3 â72 +19.0 â73 --14.7 â74 --26.5 â75 +37.2 â76 +23.8 â77 --7.2 â78 +6.6 â79 +18.4 â80 +32.4 â81 --4.9 â82 +31.4 â83 +22.5 â84 +6.3 â85 +32.2 â86 +18.5 â87 +5.2 â88 +16.8 â89 +31.5 â90 --3.2 â91 +30.5 â92 +7.7 â93 +10.0 â94 +1.3 â95 +37.4 â96 +23.1 â97 +33.4 â98 +28.6 â99 +20.9 â00 ???
S&P; â49 â53 â57 â61 â65 â69 â73 â77 â81 â85 â89 â93 â97
*--*
Source: American Assn. of Individual Investors
More to Read
Inside the business of entertainment
The Wide Shot brings you news, analysis and insights on everything from streaming wars to production â and what it all means for the future.
You may occasionally receive promotional content from the Los Angeles Times.


